Elasticsearch+Kibana+Metricbeat收集系统信息并展示仪表盘

一、Metricbeat

  • Metricbeat是轻量型指标采集器

1、下载Metericbeat

  • 下载地址:https://www.elastic.co/cn/downloads/beats/metricbeat
  • 下载成功后,解压即可
    wget https://artifacts.elastic.co/downloads/beats/metricbeat/metricbeat-7.12.0-linux-x86_64.tar.gz
    tar -zxvf metricbeat-7.12.0-linux-x86_64.tar.gz -C /usr/local/
    cd /usr/local/
    mv metricbeat-7.12.0-linux-x86_64 metricbeat

2、启动Metericbeat

  • 可以编辑:/usr/local/metricbeat.yml 配置文件
    # 启动: -e 控制台打印日志,-c 后面跟配置文件
    /usr/local/metricbeat -e -c metricbeat.yml

3、收集系统指标

  • MetricBeat使用模块来收集指标。
  • Metricbeat默认只开启了 system模块。
  • 每个模块都定义了用于从特定服务中收集数据的基本逻辑,例如Redis或MySQL。
# 查看metricbeat支持的模块列表,默认`enabled`中只有`system`,其他都是disabled不启用.
/usr/local/metricbeat/metricbeat modules list

# 启用 redis、mysql 模块
metricbeat modules enable redis mysql

# 查看各个模块的配置文件
ll /usr/local/metricbeat/modules.d
  • 手机系统指标到ES中,然后到kibana查看可视化界面
  • metricbeat.yml配置ES
output.elasticsearch:
hosts: ["192.168.31.169:9200"]
  • 启动Metericbeat: /usr/local/metricbeat -e -c metricbeat.yml

4、安装仪表盘到kibana

  • 修改配置 metricbeat.yml

    setup.kibana:
    host: "192.168.31.169:5601"
  • 然后执行命令:
    /usr/local/metricbeat/metricbeat setup --dashboards ,执行这个命令需要kibana是启动的状态

  • 如上就是成功,之后kibana就会加载有很多Metricbeat的仪表版
  • 选择添加:[Metricbeat System] Host overview ECS 可视化仪表盘

5、收集指标并自定义索引

  • 收集MySQL指标,并自定义索引
  • 配置每个模块对应一个索引
  • 启动MySQL 模块收集:./metricbeat modules enable mysql
  • 编辑MySQL模块的配置:
    vim /usr/local/metricbeat/modules.d/mysql.yml
  • 配置mysql配置内容如下:
# Module: mysql
# Docs: https://www.elastic.co/guide/en/beats/metricbeat/7.x/metricbeat-module-mysql.html

- module: mysql
#metricsets:
# - status
# - galera_status
# - performance
# - query
period: 10s

# Host DSN should be defined as "user:pass@tcp(127.0.0.1:3306)/"
# or "unix(/var/lib/mysql/mysql.sock)/",
# or another DSN format supported by <https://github.com/Go-SQL-Driver/MySQL/>.
# The username and password can either be set in the DSN or using the username
# and password config options. Those specified in the DSN take precedence.
# 数据库的IP与端口,改成你自己的
hosts: ["tcp(192.168.31.169:3306)/"]

# Username of hosts. Empty by default.
# 数据库用户名
username: root

# Password of hosts. Empty by default.
# 数据库密码
password: root
  • 修改 metricbeat 的默认配置文件:metricbeat.yml(当然也可以新建,然后以-c参数形式启动)
# =========================== Modules configuration ============================

metricbeat.config.modules:
# Glob pattern for configuration loading
path: ${path.config}/modules.d/*.yml

# Set to true to enable config reloading
reload.enabled: true

# Period on which files under path should be checked for changes
#reload.period: 10s

# ======================= Elasticsearch template setting =======================
# 我这里单机的ES,所以设置副本分片为0
setup.template.settings:
index.number_of_shards: 1
index.number_of_replicas: 0
index.codec: best_compression
#_source.enabled: false


# ================================== General ===================================

# The name of the shipper that publishes the network data. It can be used to group
# all the transactions sent by a single shipper in the web interface.
#name:

# The tags of the shipper are included in their own field with each
# transaction published.
#tags: ["service-X", "web-tier"]

# Optional fields that you can specify to add additional information to the
# output.
#fields:
# env: staging

# 自定义字段
fields:
system-name: myserver222

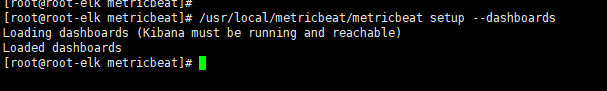
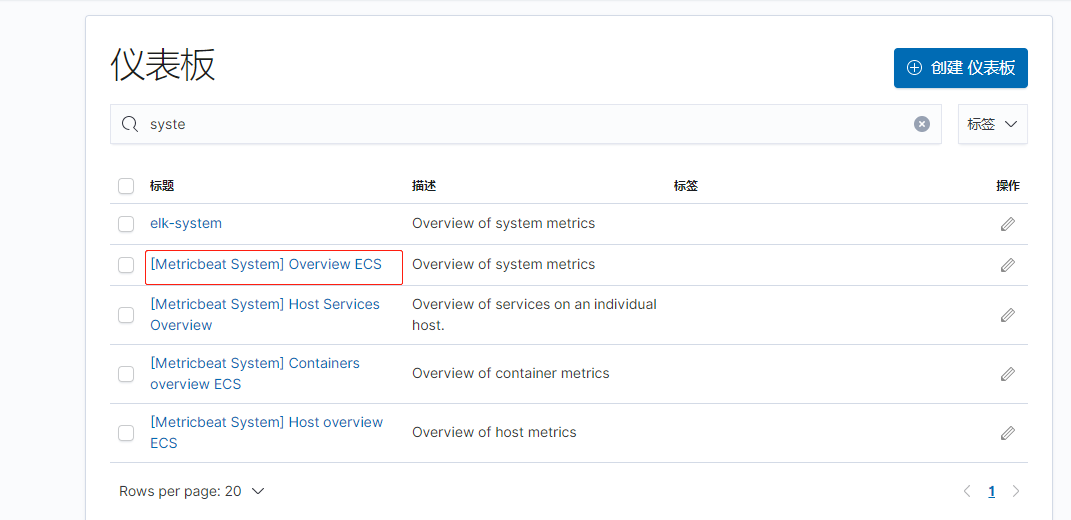
# ================================= Dashboards =================================
# These settings control loading the sample dashboards to the Kibana index. Loading
# the dashboards is disabled by default and can be enabled either by setting the
# options here or by using the `setup` command.
#setup.dashboards.enabled: false

# The URL from where to download the dashboards archive. By default this URL
# has a value which is computed based on the Beat name and version. For released
# versions, this URL points to the dashboard archive on the artifacts.elastic.co
# website.
#setup.dashboards.url:

# =================================== Kibana ===================================

# Starting with Beats version 6.0.0, the dashboards are loaded via the Kibana API.
# This requires a Kibana endpoint configuration.
setup.kibana:

# Kibana Host
# Scheme and port can be left out and will be set to the default (http and 5601)
# In case you specify and additional path, the scheme is required: http://localhost:5601/path
# IPv6 addresses should always be defined as: https://[2001:db8::1]:5601
host: "localhost:5601"

# Kibana Space ID
# ID of the Kibana Space into which the dashboards should be loaded. By default,
# the Default Space will be used.
#space.id:

# ================================== Outputs ===================================

# Configure what output to use when sending the data collected by the beat.

# 这个是模板名称可以随意填
setup.template.name: "metricbeat_dcs"
# 这个和索引相关,索引模板通配
setup.template.pattern: "metricbeat-*"
# 是否重新
setup.template.overwrite: true
setup.template.enabled: true
# 自定义ES的索引需要把ilm设置为false
setup.ilm.enabled: false

# ---------------------------- Elasticsearch Output ----------------------------
output.elasticsearch:
# Array of hosts to connect to.
hosts: ["localhost:9299"]
# 配置自定义索引,索引以metricbeat- 开头是因为刚好可以使用 metricbeat提供的dashboards模板
index: "metricbeat-%{[fields.system-name]}-%{[event.module]}-%{[agent.version]}-%{+yyyy.MM.dd}"
# Protocol - either `http` (default) or `https`.
#protocol: "https"

# Authentication credentials - either API key or username/password.
#api_key: "id:api_key"
#username: "elastic"
#password: "changeme"


# ================================= Processors =================================

# Configure processors to enhance or manipulate events generated by the beat.

processors:
- add_host_metadata: ~
- add_cloud_metadata: ~
# - add_docker_metadata: ~
# - add_kubernetes_metadata: ~
  • 启动即可。

-------------本文结束 感谢您的阅读-------------